
“This blog is authored by Neil Maedel, a director at Sonoro Gold Corp. The opinions expressed are for general informational purposes only and do not constitute investment advice or recommendation.”
So what’s wrong with gold? – The Four Horsemen
Recently I was sent a copy of “Snapshot: Gold Mining Sector Outlook” by S&P Global. It’s a great research summary and well worth reading – you can get it here.
Looking at some of the report’s charts what struck me the most was the real decline over the past several decades in terms of the return on the money spent exploring. They show that during the 1990s, an average of less than US $2 billion was spent on exploration annually, while gold discoveries exceeded a total average of 120 million ounces per year. That works out to about US $16.60 for every ounce of gold discovered. In contrast, the average spent between 2011 and 2021 exceeded US $5 billion per year, yet the average amount of gold discovered annually is estimated to be around 251 million ounces, once all discoveries are reported.
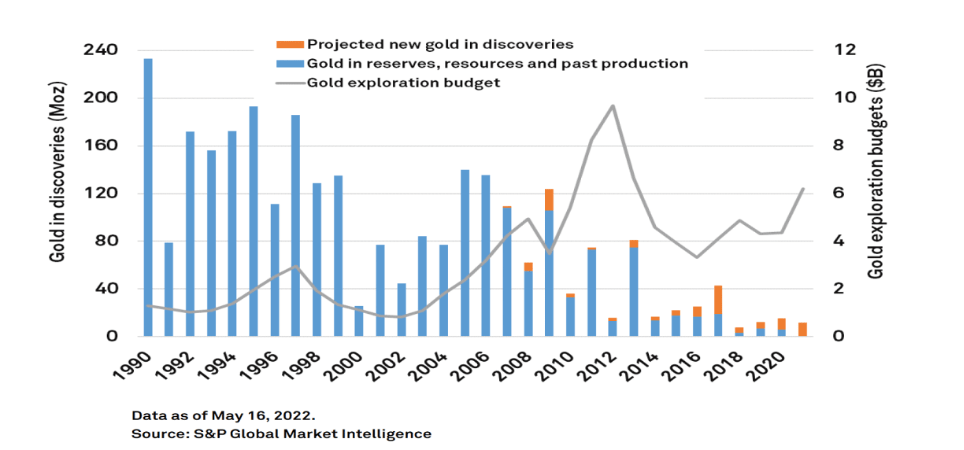
That works out to a ‘finding’ cost of $199 for every ounce of gold discovered, compared to $16 in the 1990s. Yikes.
From this we can conclude:
- Exploration has become very difficult with poor returns, generally;
- The low success rate explains why investors have largely deserted the sector;
- The low success rate also means that once the larger gold discoveries made a decade or more ago are developed and begin producing gold, there will be very little left in the pipeline to be developed and added to future mined gold supply;
- According to S&P Global the decline in mined supply is expected to begin in 2025.
On the bright side:
- The approaching deceleration in the mined supply of gold should result in higher gold prices;
- Because there are very few companies that have potentially mineable gold discoveries, companies which do will be increasingly attractive to investors once the gold sector is back in the spotlight;
- Gold sector secular upswings generally begin with bullion, royalty companies such as Franco Nevada or Royal Gold and the lowest risk gold producers (diversified major gold companies operating in low risk regions like Barrick or Newmont Mining);
- Mid-sized producers are next followed by companies distinguished by their nearness to becoming a cash flowing gold producers, and as various mine development milestones are achieved, the apparent de-risking may also provide an additional share price catalysts and upside momentum;
- Gold discoveries, as shown in the S&P Global Report, are becoming increasingly rare so companies, which are in the final stages of becoming gold producers, may have their share price upside increased by growth-enhancing potential brownfield or nearby on trend expansion of existing gold zones;
- This brownfield potential can be the most compelling type of exploration because it may leverage the existing infrastructure, improve the economics by extending mine life, lower costs while adding to the value of existing resources and with considerable infrastructure already in place, development and integration into an existing mine or planned mine is usually far quicker and easier;
- Because of real shortage of new gold deposits being discovered and developed, existing mid-sized gold producers find it a big challenge to replace their depleting gold deposits and, as a consequence, companies developing new mines, which have significant brown field discovery potential, are likely to be compelling takeover candidates for gold producers looking to replace or grow their gold resources.
On gold’s price:
There are a multiple of factors, which may work alone or together, to affect gold’s price and many are not necessarily immediately apparent. The 1970s gold bull market is commonly attributed to inflation when in fact there were other contributing causes. It was not until 1974 that Americans could legally buy gold for investment. Forty years earlier, the US government confiscated privately owned gold and paid the owners US $21.67 per ounce in compensation, which was at that time, the conversion rate for dollars into gold. Foreign central banks could still continue convert their dollars into gold and a year later, the US Treasury effectively devalued the dollar by increased the number of dollars exchangeable into an ounce of gold by these Central Banks from US $21.60 to US $35.
Gold: free at last
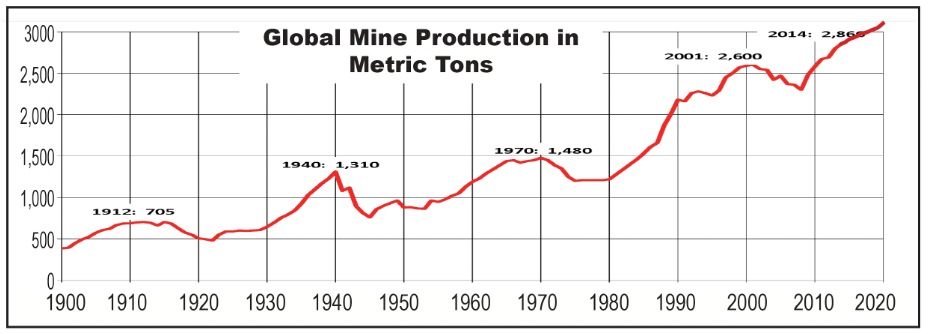
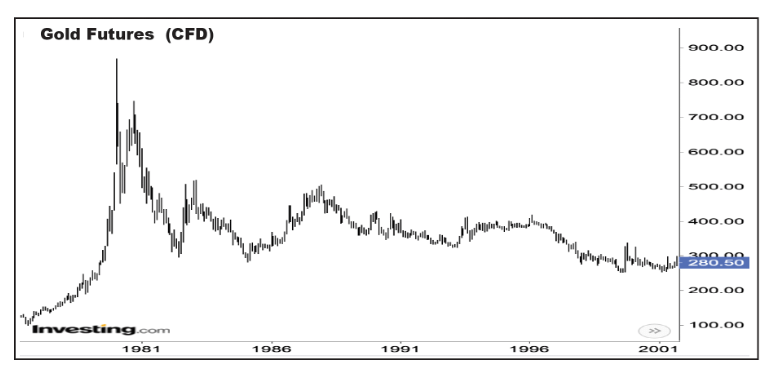
By the 1970’s, gold had been pegged at an artificially low price for decades. The low price discouraged both exploration for new gold deposits and the development of new mines. It takes a decade or more to turn a discovery into a working mine so there is always a considerable lag between higher prices and increased production. So even though gold’s price rose dramatically beginning in 1974, global mined gold production still registered a decline of 24%, from 1,623 tons in 1970 to 1,226 tons in 1977. While gold production was declining, the 1974 law unleashed four decades of pent-up consumer buying demand. Accelerating inflation, a weak dollar and later fears that the Iran revolution would spread to Arab oil producers and cripple key sources of energy, added to gold demand as there were few other ways to hedge rising geopolitical risks and rising prices, other than farmland and other precious metals. The result was a series of buying panics which ultimately drove gold’s price to a high of US $874.
Twenty two year gold glut
Mined gold production subsequently doubled over the next 22 years. Instead of too much demand and not enough supply, the situation was reversed. Mined supply increased and not just from mining. Central Banks, as an organized selling group, sold an average of 250 tons of gold every year until 2001. The LBMA, which was unofficially backstopped by The Bank of England, added to supply with the creation of a paper gold derivatives market. High interest rates and falling gold price made it profitable for large institutions to lease gold from the bullion banks at 1%, sell the gold and then use the proceeds to buy US treasuries. As long as treasuries yielded more than 1% and gold’s price did not rise, it was a profitable arbitrage. Especially considering that for most of the decade treasuries paid between 3% and 7.2%. An imploding former Soviet Union added further to gold supply until 1999 when gold’s price bottomed at US $254. The sector’s biggest miners were their own worst enemies as they added to the supply deluge by selling forward their gold production. It was not a small amount. American Barrick (now Barrick) was the industry’s biggest gold bear and champion hedger. By 2001, it had sold forward a gigantic 18.3 million ounces of gold, or roughly a fifth of all the gold mined globally that year.
Gold’s 2001-2007 bull market
Mined gold production peaked in 2001 and then fell slowly to reach a low of 2,285 tons in 2008. As mined production drifted lower and Central Banks flipped from net sellers to buyers, rock bottom interest rates and a rising gold price made the selling short against leased gold unprofitable. Beginning with Newmont’s 2002 acquisition of Normandy Mining, most miners stopped forward selling their gold production. Barrick was the last major to discontinue the practice, which it did in 2007 with a spectacular US $5.6 billion loss.
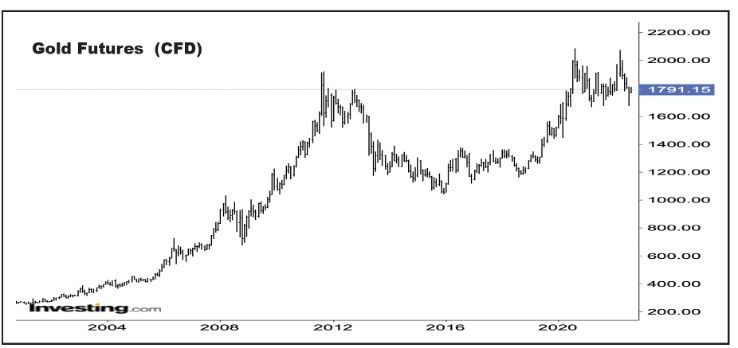
Similar to what we may see when the current Tech stock bear market is over, by 2003 the NASDAQ had collapsed, by just over 75%. At the same time slowly rising gold, energy and real estate began to attract investors. The introduction and proliferation of gold ETF’s, beginning with Street Tracks Gold Shares (GLD) in 2004, was also a major factor in gold’s 2003-2011 bull market. The ETFs allowed millions of investors of all sizes to easily, and near-instantly, trade small fractions or large tranches of gold and they did. By 2007, GLD held 603 tons of gold in trust for its ETF holders, which was more than 25% of the gold mined that year.
Common factors
So what are the commonalities? Both bull markets were accompanied by periods of declining supply and increased demand. Investors’ desire to hedge accelerating inflation, geopolitical risk and the lack of investment alternatives were certainly factors in the 1970s. But the 2001-2011 bull market inflation was less of an issue. The causes were more complex as multiple factors combined resulting in a significant reduction in supply, just as novel bullion-centric financial products attracted a very large cohort of new gold buyers. At the time, gold was bought less as an inflation hedge and more for its lack of counter-party risk and because many investors believed, as exemplified by Barrick CEO Aaron Regent’s ill-timed 2009 claim, that global gold production had peaked back in 2001. Following the Global Financial Crisis an added reason to buy gold was that quantitative easing (QE) was expected to cause runaway inflation.
Today’s environment
As history shows, gold production did not peak and despite a cumulative five fold Fed balance sheet expansion, QE was not inflationary. What gold bugs missed was that money was mostly used as a means to bail out Wall Street with a pittance actually ever getting to Main Street. That the public would be left hanging in the wind was epitomized by then Treasury Secretary Timothy Geithner’s statement to Neil Barofsky, the former special inspector general for the Troubled Asset Relief Program. To Geithner, millions of hapless, eventually foreclosed homeowners were by design just “foaming the runway” so that banks would have enough time to repair their balance sheets using other parts of President Obama’s bailout plan.
A decade later President Trump responded to a still nascent Covid-19 crisis by launching a populist rescue program that the democrats had no choice but to match. In 2020 alone, the US government dished out more than US $5 trillion to the general public, mostly financed by another US $4.8 trillion Fed balance sheet expansion. Inflation was just starting to accelerate last February when Russia invaded the Ukraine. In reaction the Biden administration placed sanctions on Russian exports which exacerbated existing global shortages, while severely punishing consumers around the world, especially America’s EU allies. It is against this backdrop: a major European war, commodity shortages, global central bank tightening and what looks like an imminent global downturn, another 18 months of gold supply growth and the fracturing of the dollar based international monetary system, that gold is trading.
A mountain of fiat gold
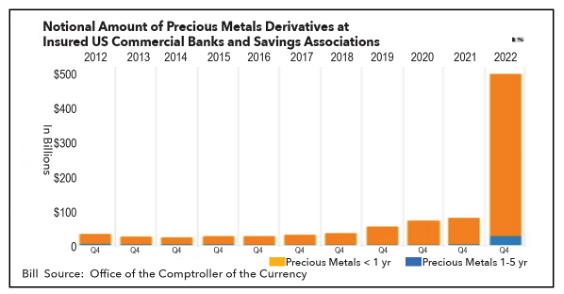
One potential gold price upside catalyst is a now officially disclosed mountain of fiat gold. Peter Hambro, a descendent of Baron Carl Joachim Hambro – the founder of Hambro’s which merged with Mocatta & Goldsmid and was the principle gold and silver counter-party to the Soviet Union, is a consummate London Banking establishment insider. In the London Weekly ‘Reaction’, his article “Don’t forget the golden rule: whoever has the gold makes the rules”, he warns of the potential for a gold price explosion. Hambro writes “since 2018 the Financial Stability Desks at the world’s central banks have followed the Bank of International Settlements’ instruction to hide the perception of inflation by rigging the gold market”. To do this, a tag team consisting of commodity traders in the US and bullion traders in London, has created a mountain of ‘fiat gold’ which they sold to retail investors to suppress gold’s price.
The mother of all short squeezes?
The issue now, Hambro tells us, is that according to the US Office of the Comptroller of the Currency, the notional amount of paper gold sold via US Commercial Banks and Savings Associations has reached a gob-smacking half a trillion dollars. And if inflation was hidden then, it is most certainly not now. In comparison, it’s like Barrick’s hedge book times 100. Some of the derivative position is likely to be on more volatile silver – but is not recorded. Even still, if only half of the US $500 billion is gold sold short, it would be equal to around three years of world-mined gold supply. Every ounce of gold sold, using borrowed LBMA gold, is an ounce that must be bought back in the future. And while some of these derivatives may net out, half of the US $500 billion is substantial. The caveat is that this is clearly an inside job and rule changes or rule-fudging in favor of too big to fail institutions would not out of character. Even still it amounts to a seriously bullish iceberg buy order for around 9,000 tons of gold using the current price. Given that only 3,560 tons was mined globally last year, it’s not a small problem.
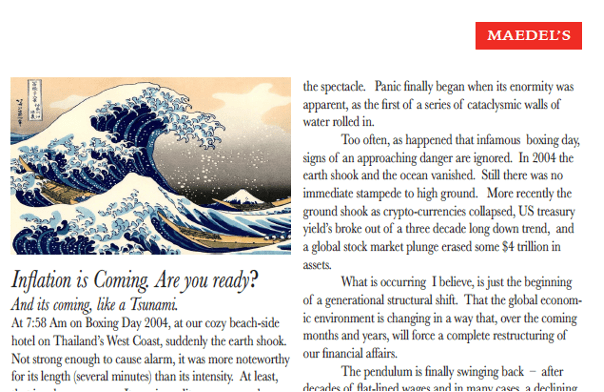
Inflation is coming are you ready May 2018
Four years ago, I wrote ‘Inflation is coming are you ready’ which warned of an approaching 1970s-like environment as we have now. I detailed what I expected would be “Growing world disorder” accompanied by reversing globalization, shrinking work forces, increasingly polarized and militant populations, as oil, natural gas and food became more costly. A key point was global and US indebtedness which dwarf 1970s levels. In subsequent reports, I detailed how global warming would increase food costs, make famines worse and more common and increase energy needs and prices, while warning of an approaching Cold War II and correctly predicting the ongoing Ukraine–Russia war.
As commodity markets correct over the coming months I expect it is an opportunity to accumulate energy and precious metals company shares in anticipation of the next major market move higher. Mined gold supply may be expected to grow 5% this year but compared but to not be positioned given the kind of buying panics possible, selling short or staying on the sidelines like picking up nickels in front of a steam roller. The afore-mentioned half trillion-dollar iceberg bid is one possibility, while a more gradual but still growing gold demand from non-dollar trading regimes is another. The US dollar-based financial system is slowly fragmenting and as a result gold is becoming more integral to banking and trading currencies. BRICS nations (Brazil, Russia, India, China, and South Africa and quite possibly Iran, Venezuela and Turkey) are planning to develop a national gold backed currency for trade settlement, lending and to eliminate US oversight and the threat of US dollar linked sanctions.
Defiance
In defiance Indian and Chinese companies are buying sanctioned Russian coal, oil and LNG using Chinese yuan. Russian aluminum giant Rusal just issued a two-times oversubscribed 4 billion yuan (US $590 million) bond. The ruble is trading at a 7year high and the euro, a 20-year low. The resource wars have started and we have not even factored in water scarcity yet. Russia has all the gold, water, energy and food it needs. Europe, as the collapsing Euro shows, is among the many that do not. This era of inflation will be driven by growing scarcity of food, energy and water and an abundance of conflict. The geopolitical and financial implications make holding physical gold, (because it has no counter-party risk) an increasingly necessary strategy. As Putin demonstrated, gold held in country are real assets which cannot be stolen. America’s weaponization of the US dollar based system and international banking is an increasingly big deal these days and it makes gold’s role as a reserve asset all the more compelling.

So what’s wrong with gold?
I get asked, “So what’s wrong with gold?” Inflation is 9% and gold is still going down. Gold is a long-term hedge or insurance on counter-party risk and this makes the current short-term inflation less important. Instead it is what investors expect inflation to be years in the future that is a key factor. Gold’s price trends also reflects growing or contracting financial liquidity. So short term setbacks are normal as weak holders are forced to sell not what they should but what they can. In terms of inflation, the 5 year break-even for 10-year US treasuries is around 2.98%. That’s a third of the current CPI, so on a long-term basis, few expect inflation – hardly a reason to own gold. As inflation expectations increase so should gold’s price.
Counter-party risks globally are far more of a problem as a worsening cold war-like environment combines with collapsing growth that is followed by stagflation. Credit default swap premiums on both emerging market bonds and Europe’s banks are flashing red meaning we are only one or two hundred basis points worth of Fed hikes until a major market calamity. Unless the Ukraine sues for peace, and Russian natural gas continues to flow to Europe as a consequence, industrial powerhouse, Germany, will go over a cliff this winter. Its economic model remains dependent on imports of cheap Russian energy and exports to China, both of which are in a tailspin. Where Germany goes, Italy, the European Union’s third largest economy, will not be far behind. And they will not be alone.
Meanwhile, Emerging Market (EM) high yield spreads are near 2008 crisis levels, excluding Russia and Belarus. In 2007, EM debt totaled less than 10% of global GDP, compared to US $12 trillion or 14% now. As the Federal Reserve increases interest rates, a more expensive dollar is compounding the impact of slowing trade and decreasing revenues making debt servicing almost impossible for many EM borrowers. The International Monetary Fund (IMF) says over half of low-income countries are now categorized as in debt distress or at high risk of experiencing it. Research published by the Jubilee Debt Campaign last January estimated that EM governments’ external debt payments had more than doubled since 2010 to 14.3% of government revenues. And that was last January – a lot has changed and not for the better.
It’s not as if the US is an example of exemplary fiscal management. Its Net International Investment Position is at negative 18 trillion US dollars. Never in history has a nation owed the rest of the world so much. Total government debt is US $30 trillion or, according to Trading Economics, 137.20 percent of last year’s GDP. This year mandatory spending on programs such as pensions and health care, together with interest, is around US $4.1 trillion equal to total government revenues.
The US $1.16 trillion budgeted for military spending, together with veterans affairs and military aid, will need to be borrowed, as will Federal assistance to schools, high tech programs and everything else. And it is not as if most other G7 countries are in better financial shape, because most are not. The escalating default risk across both emerging and developing economies, is exacerbated by growing divisions between the West and the rest of the world, as energy, food and water shortages leave central banks faced with choosing between depression and stagflation. For now, it is quantitative tightening lite. Come winter, however, when increased energy (and food) costs combine with plunging economies and rocketing unemployment, the riots will begin. Will the FED then pivot back to quantitive easing. If it does, as seems likely, gold’s next up move should begin in earnest and Mr. Hambro’s trapped derivative gold sellers, may yet be forced to start covering. Under these circumstances, gold and gold stocks will fly.

Neil Maedel
Please always do your own research. For example the internet can be a powerful tool. You can easily check insider sales or purchases via yahoo finance or use search engines to learn about the gold mining sector. Do this and invest in only what you understand. As always it is essential as an investor that you should individually make your own judgements as to the appropriateness of any securities including any discussed in this blog. No statement or opinion or matter herein is either directly or indirectly an offer or solicitation to buy or sell any of the securities mentioned. This blog is authored by Neil Maedel, a director at Sonoro Gold Corp. The opinions expressed are for general informational purposes only and do not constitute investment advice or recommendation and do not necessarily represent the opinions of Sonoro management.